Belgians still do it with their computer
 Every year, Google unveils its Consumer Barometer, which offers insights on what Internet users do online, what device they use, where they buy stuff (online or offline) and what they purchase online. The findings can be viewed for the whole world, but also per individual country. Because when it rains in Paris, it may very well drizzle in Belgium, like the Belgian proverb says, but that is not true for everything!
The numbers tell the tale, and what they tell is precisely what can help you develop your target audience and your strategy. It is with this aim that Google published, for the fourth year in a row, its Consumer Barometer. This tool is intended to identify trends that can help you adapt your range of products and services to your target audience. By using the filters, you can also search data yourself, in order to make a comparison between certain countries, like Belgium, France and the Netherlands for instance, in order to find out more info about specific aspects of the research. This is useful when you also sell your products or services in neighbouring countries.
Here are a few noteworthy observations:
- The Netherlands are the world champions when it comes to connected devices (devices offering Internet access): 3.6 devices per person, against 2.5 devices in Belgium. 14% of Belgians still have no connected devices at all, while 1% of the Dutch own no less than 11 devices!
- In Japan, 95% go online every day. In Belgium, most Internet users of all ages go online too, but the odd thing is that 71% of users aged over 55 also go online every day. So, this is a target audience that you should not ignore!
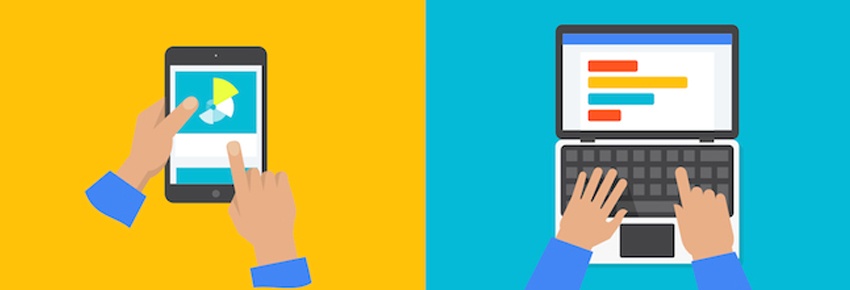
- Belgians usually go online using their computer or tablet: 57% of Belgians said they do it only via their computer or tablet, against 36% of Dutch. In France, only 4% go online using their smartphone, and in the Netherlands, 10% do it more often with their smartphone than with their computer or tablet.
- What do we do with our smartphones? Oddly enough, what we mostly do with those rather expensive devices is quite futile, at least in Belgium. 56% use their smartphone as a clock, 41% to watch pictures, 42% as an agenda, 31% to watch the weather, 29% to listen to music, and 27% to play games.
- But we also search for products before we purchase them. In this context, the smartphone is used in 11% of cases. We mostly go online to search for TVs, and then purchase them offline (58%). Other popular searches include: movie theatres (47%), insurance (43%), household appliances (31%), groceries (11%) and clothing (9%).
Are you looking for more statistics? Feel free to use the Graph Builder!
Related posts